Processing - Event Sequencer
Overview
Makes use of the processing.org sketchbook to try out some ideas of rendering transitions of elements through a state diagram
Example output:
Below is a sample of the output, where the circles represent the states and the lines are representative of elements transitioning from one state to another.
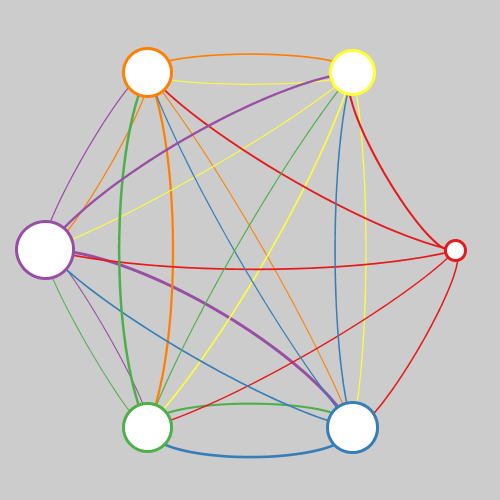
Visualization bindings:
- The color of the line denotes the destination state of the elements in transition.
- The weight of the line denotes is scaled to the number of items transitioning.
- The size of the state circle denotes the population of the state.