Sketches
-
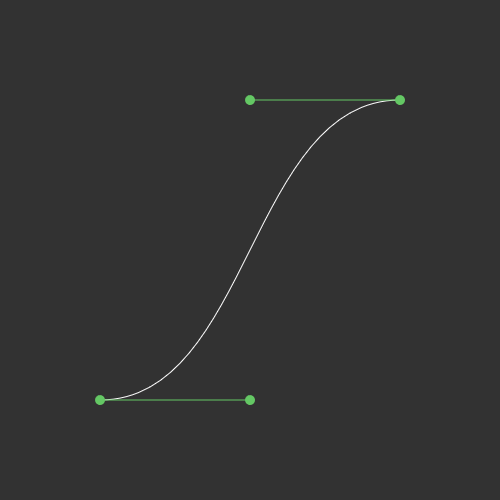
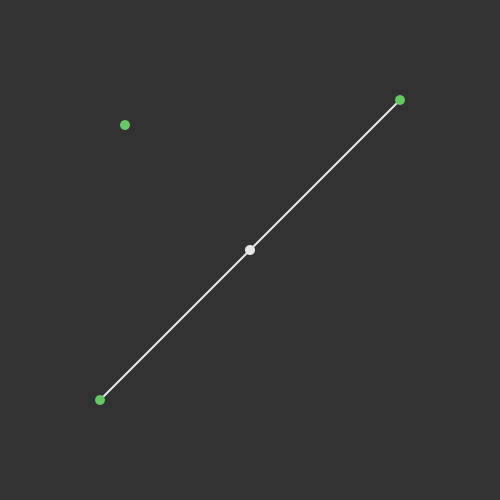
Demonstrates the display and interaction of a Bezier curve modeled as an object, with draggable control points.
-
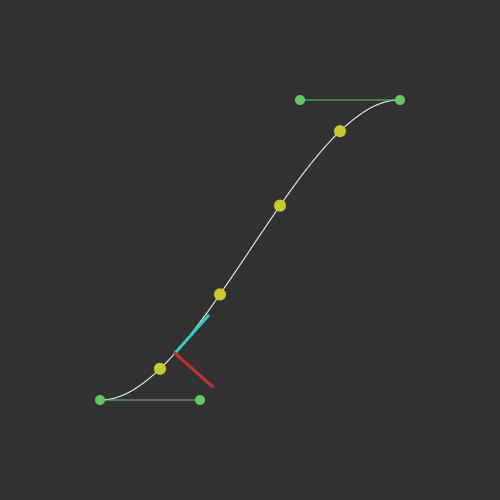
Demonstrates the additional functionality of a Bezier curve, to get points along the curve and other features.
-
Very simple introductory sketch to demonstrate basic animation of a ball bouncing around the canvas.
-
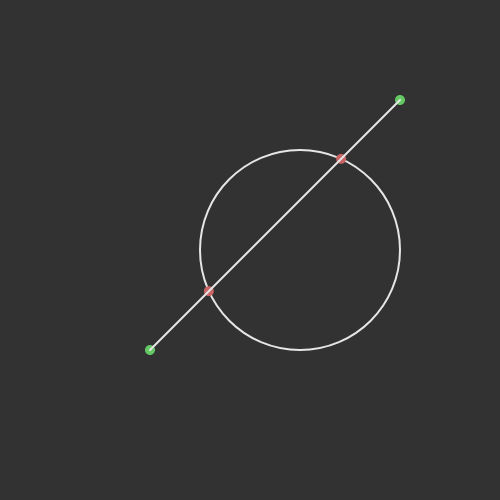
Demonstration of the algorithm to find intersection of a line with a circle.
-
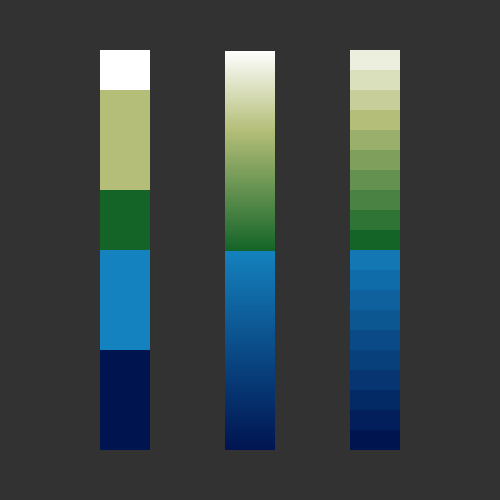
Demonstrates P5jsColorRamp capabilites, to provide for multi-segment color bands for elevation tints, precipitation maps, etc.
-
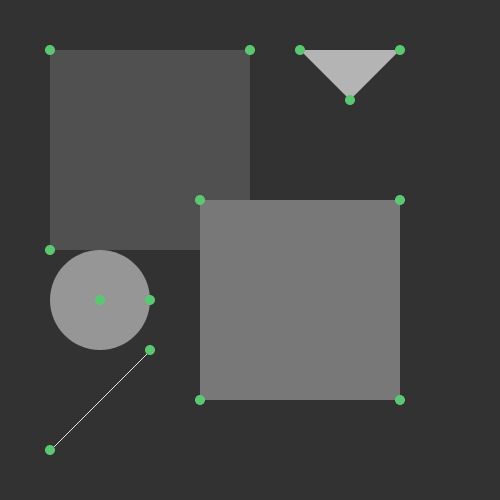
Implements draggable shapes for use in other sketches.
-
A demonstration of the options for laying out objects using LayoutUtils.
-
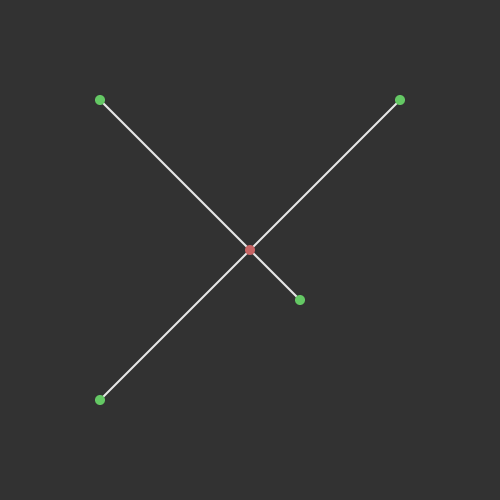
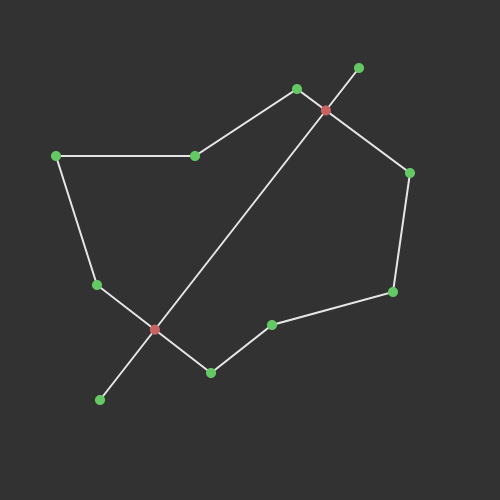
Demonstrates determination of line-to-line intersection.
-
Demonstrates the drawing of a simple Paisley shape.
-
Demonstrates the drawing of a simple Paisley shape.
-
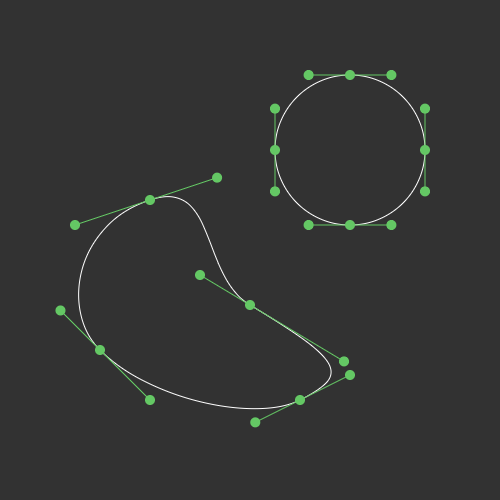
Demonstrates the display and interaction of "PolyBezier" (aka Composite Bezier) which is a set of connected bezie-curves.
-
Demonstrates the point-to-line (nearest point).
-
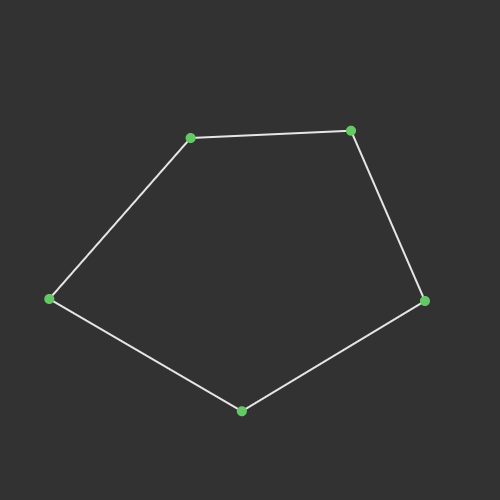
Demonstrates the drawing of a Polygon
-
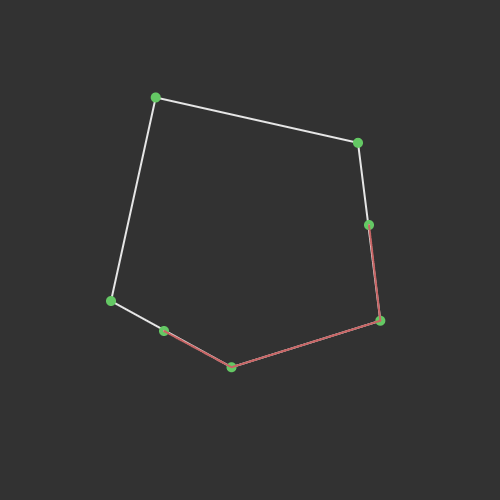
Demonstrates the determination of the line segments along the perimeter of a polygon between two points.
-
Demonstrates determination of polygon-to-line intersection points.
-
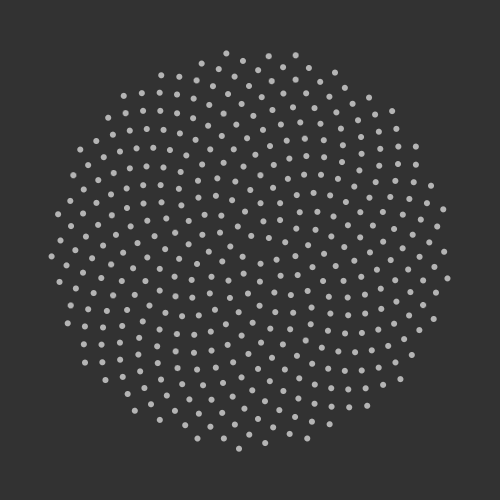
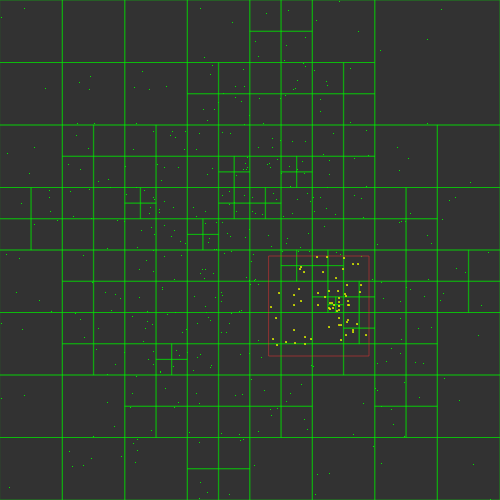
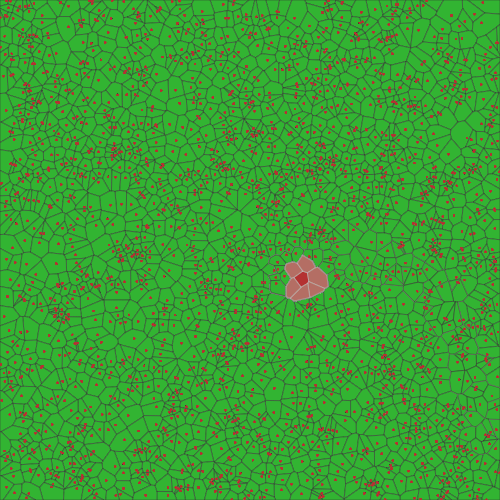
Implementation of a quadtree data structure, which groups data points into successively nested quadrants, which allows for fast access of elements in an area.
-
Implementation of a quadtree data structure, which groups data points into successively nested quadrants, which allows for fast access of elements in an area.
-
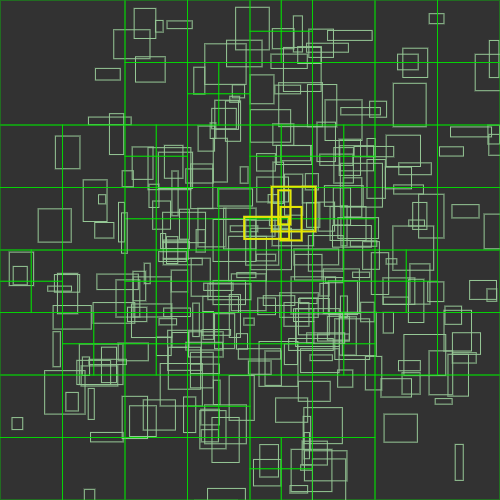
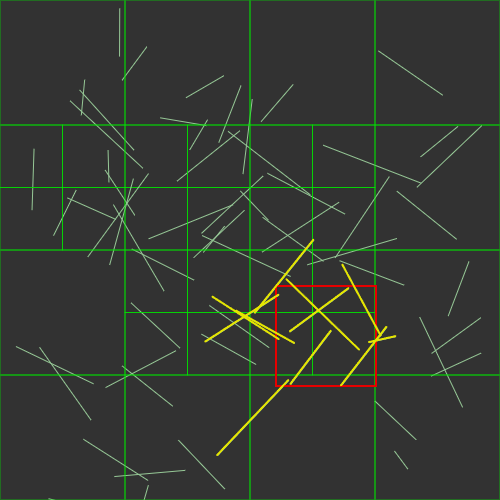
Demonstrates storing line segments within a Quadtree structure, and querying by either rectangle or another line-segment.
-
Demonstrates P5jsUtils.getRandomColorByID() to get one of the 6 primary and secondary colors (in RGB mode; HSB mode this is trivial);
-
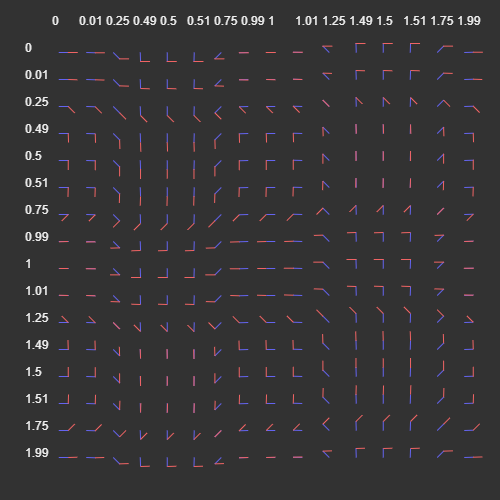
Implementation of a basic function rotationBetweenVectors() to compute the rotation between two vectors.
-
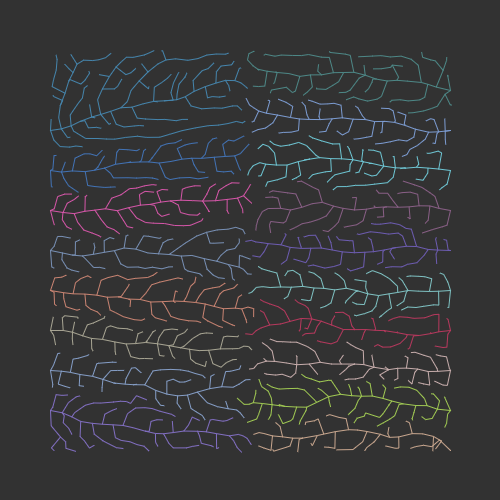
Demonstrates a generalized implementation of the 'space colonization' algorithm, for use in non-botany related contexts and with addtional layout options.
-
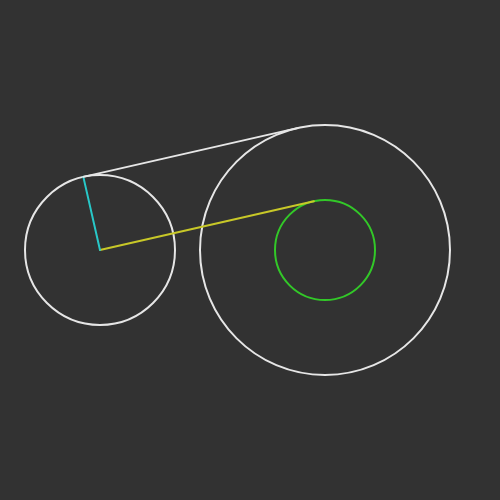
Demonstrates drawing tangents between two circles.
-
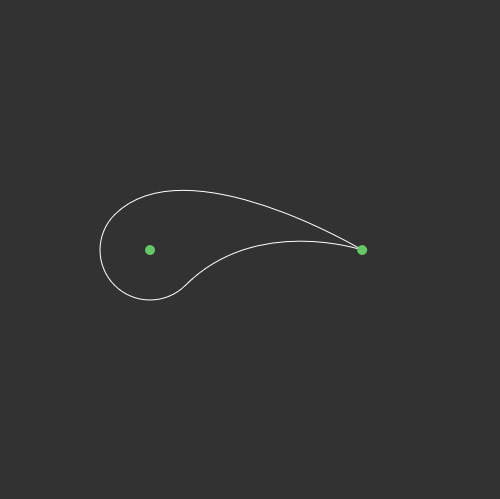
Demonstrates the display and interaction of teardrop shapes.
-
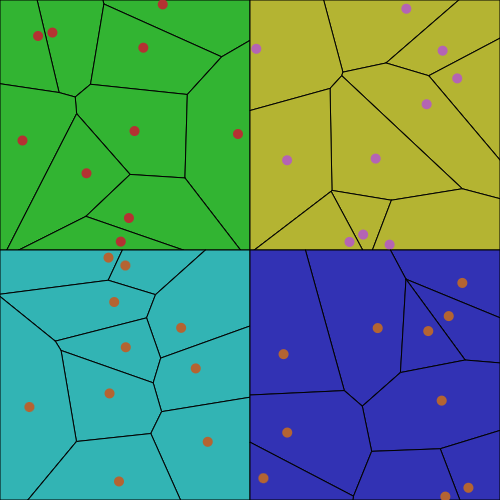
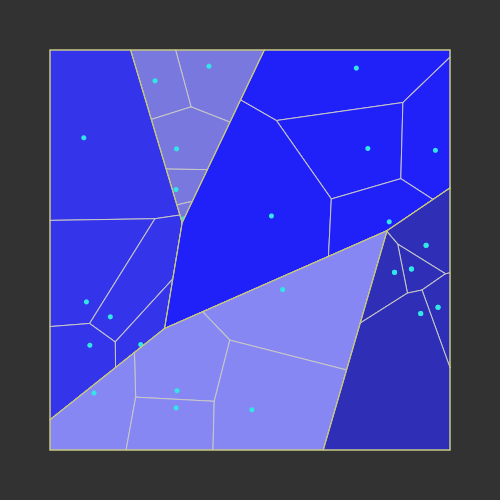
Demonstrates preliminary modified p5.voronoi, working towards multiple interactive diagrams in one sketch.
-
Demonstrates the modified p5.voronoi to have multiple interactive diagrams in one sketch.
-
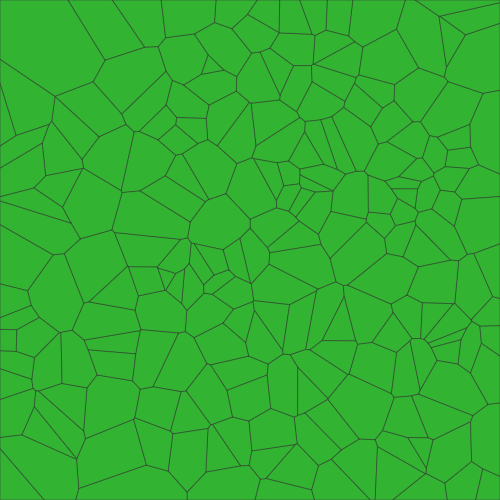
Explores some optimizations in regards to Voronoi diagrams.
-
Explores using the d3-delaunay library to generate the voronoi diagram.
-
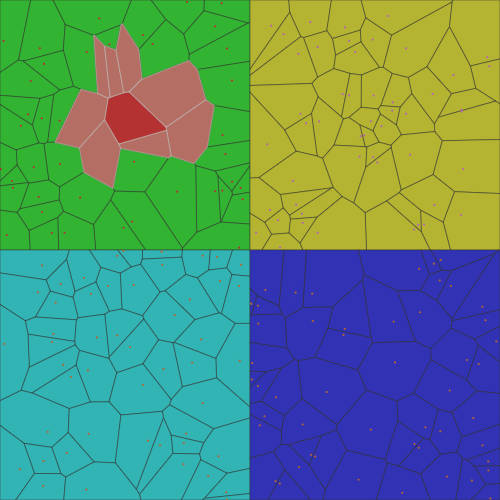
Demonstrates creating a nested Voronoi diagram.
-
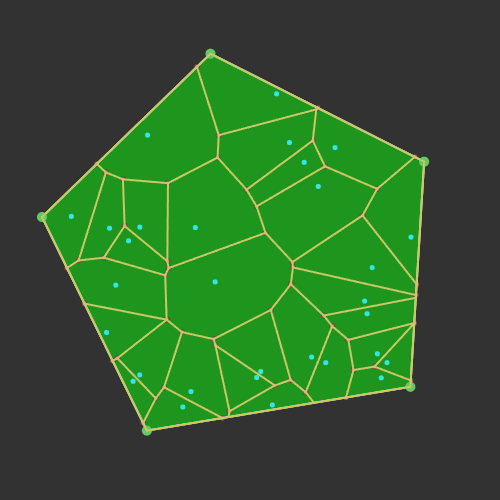
Demonstrates creating a Voronoi diagram with a non-overlapping polygon as the bounding container.
-
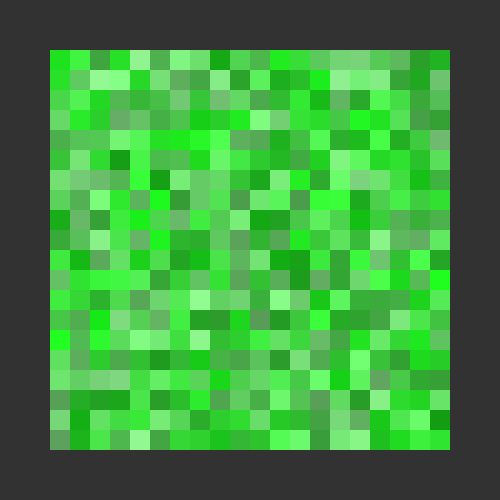
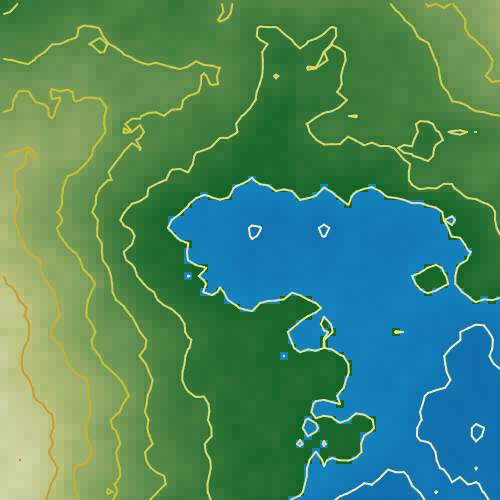
A sketch to focus on and explore alternate ways of generating terrain.